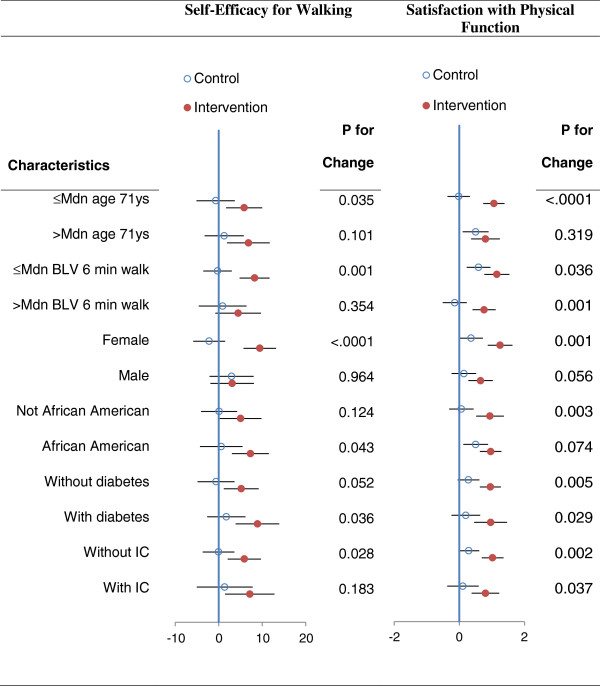
Figure 1.
Forest plots for treatment differences (±95 CI) on selected characteristics for self- efficacy and satisfaction with physical function. Legend: Mdn = median; BLV = baseline visit; IC = intermittent claudication; the plotted points represent change from baseline for the control and intervention groups and the p values to the right are the probability values for the control versus treatment comparisons.

