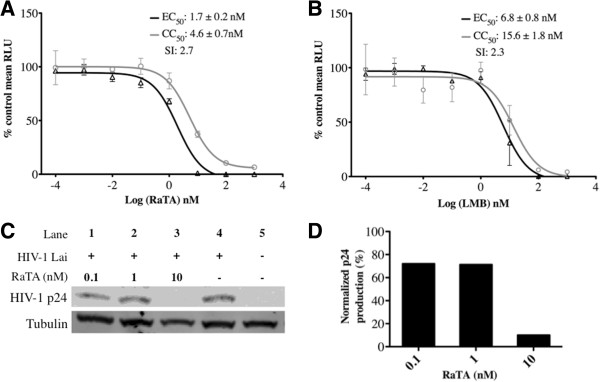
Figure 2.

Potency of ratjadone A against HIV infection of TZM-bl cells. Cells were seeded in 96-well plates in triplicate and treated with increasing concentrations of RaTA (A) or LMB (B) and infected with HIVLAI at a multiplicity of infection (MOI) of 0.5. 48 h after infection cells were assayed for luciferase activity and the mean relative light units (RLU) were plotted as % relative to DMSO (vehicle) for both infectivity and cell viability. Effective Concentration 50 (EC50) and Cytotoxic Concentration 50 (CC50) were estimated by non-linear regression of log inhibitor vs. normalized response and used to calculate the Selectivity Index (SI) value (see Materials and methods). Bars: standard error of the mean (SEM). For panels (C) and (D), cells were HIV infected by spinoculation, seeded in 6-well plates and treated with increasing concentrations of RaTA. 48 h after infection, cells were lysed and analysed by Western Blotting (C). HIV p24 bands are shown in the upper row. Lanes 1 to 3: cells incubated with RaTA at different concentrations; Lane 4: DMSO control; Lane 5: uninfected DMSO control. Tubulin was used as a loading control (lower row). Every band in panel C was normalized respect to the loading control and quantified. The relative p24 production was plotted as % relative to DMSO control (D). The drug solvent concentration (0.1% DMSO) in every sample was constant.
