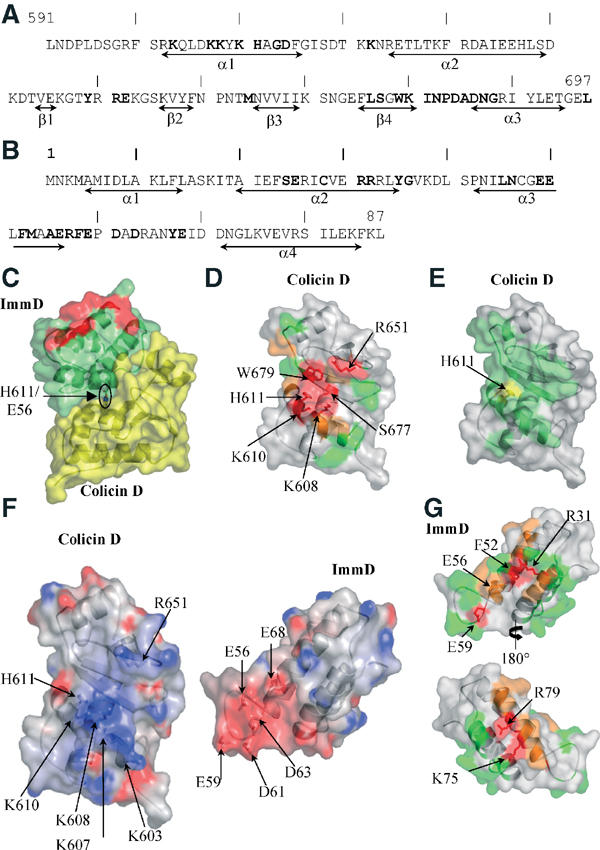
Figure 2.

Molecular surface representation. (A, B) Secondary structure assignments along the colicin D (A) and ImmD (B) sequences. Residues involved in complex formation are highlighted in bold. (C) The binary colicin D (yellow)–ImmD (green) complex. The orientation is the same as in Figure 1A. The red-coloured region corresponds to ImmD positions located outside the interface, but whose mutation abolishes or reduces the inhibitory capacity. (D) Surface mapping of the colicin D catalytic active site residues. Unmutated positions are coloured grey. Residues whose mutation does not alter tRNase activity are shown in green, those whose substitution results in partially or fully inactivated proteins are depicted in orange and red, respectively. For clarity, only residues whose mutation results in complete loss of activity are labelled. (E) ImmD foot-printing (green) at the colicin D surface. The His611 residue is coloured yellow. The orientation is the same as in (D). (F) Open leaflet representation of the complex illustrating the electrostatic complementarity between colicin D and ImmD. Regions of the surface with negative potential are coloured red and those with positive potential are in blue. The colicin D orientation is similar as in (D). The ImmD is rotated 180° around the vertical axis. (G) Surface mapping of the ImmD residues involved in the inhibitory effect. Colour coding is the same as in (D). The orientations of the ImmD in the top and bottom panels are related by a 180° rotation around the vertical axis.
