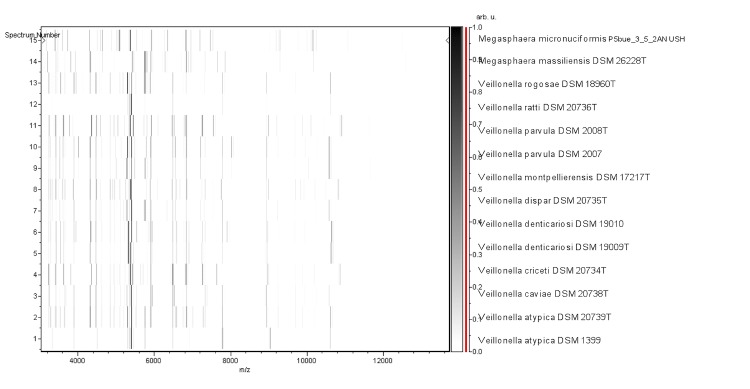
Figure 5.

Gel view comparing the M. massiliensis NP3T spectrum with those of M. micronuciformis and Veillonella species. The Gel View displays the raw spectra of all loaded spectrum files arranged in a pseudo-gel like look. The x-axis records the m/z value. The left y-axis displays the running spectrum number originating from subsequent spectra loading. The peak intensity is expressed by a Gray scale scheme code. The color bar and the right y-axis indicate the relation between the color a peak is displayed and the peak intensity in arbitrary units.
