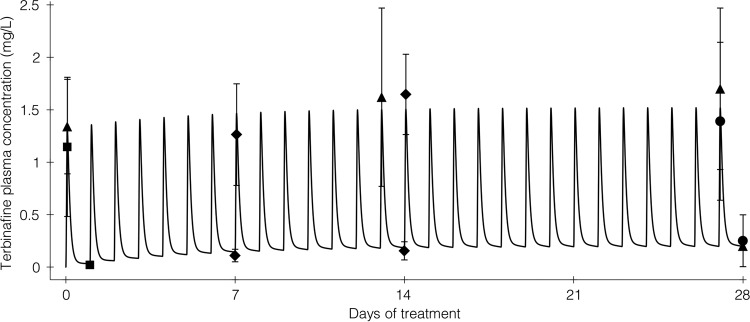
FIG 5.

Predicted versus observed terbinafine concentration-time profile following terbinafine 250 mg q24h for 28 days. The solid line represents the PBPK model-predicted terbinafine concentration-time profile, with closed symbols representing mean observed peak and trough terbinafine concentrations during the first 4 weeks of treatment reported in four pharmacokinetic studies. Observed data are from references 13 (closed triangles), 21 (closed diamonds), 16 (closed squares), and 22 (closed circles; reported in reference 14). Symbol error bars represent the standard deviations of the observed concentrations; approximate standard deviations were calculated as range/4 for data from reference 21 because standard deviations were not reported.
