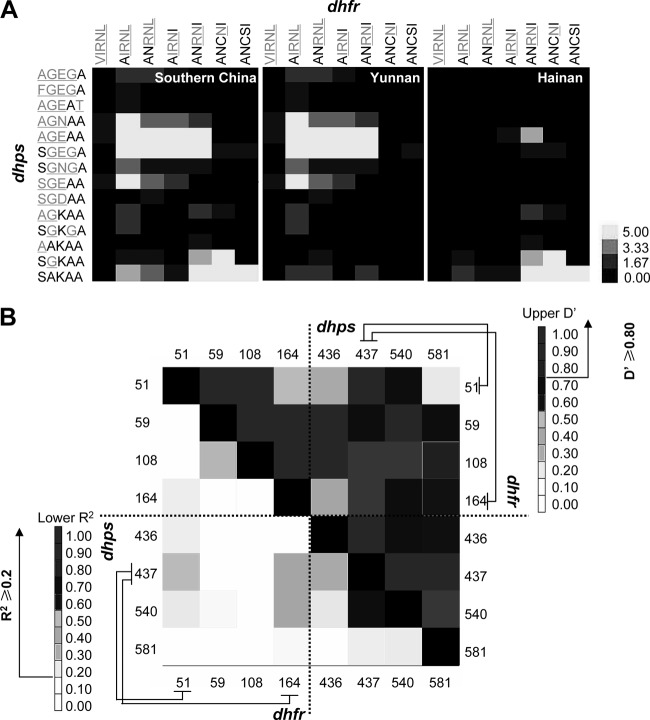
FIG 3.
Genetic linkage between pfdhfr and pfdhps alleles. (A) Linkage clustering. The level of linkage was measured by the Pearson correlation and is displayed in different colors (a χ2 test had been performed in advance, P < 0.01). The black, gray-yellow, and yellow grids represent zero, weakly positive, and strongly positive correlations, respectively. The numbers in the bar chart refer to the values of Pearson correlation grades. (B) LD analysis. The numbers on the x and y axes indicate SNP sites in pfdhfr and pfdhps. The upper right shows D′ values for all the SNP pairs, while the lower left represents r2. The grids in different colors indicate the LD level between each pairs. The arrows show the baseline in determining the significant LDs.

