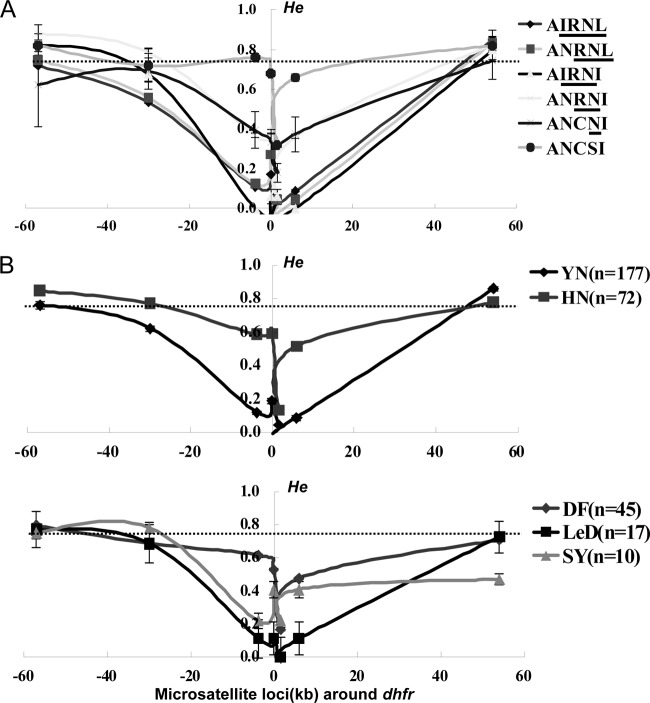
FIG 4.
Selective sweep around dhfr alleles in different regions. (A) He comparison of the wild type and five mutant groups (single, double, triple, quadruple, and quintuple mutations) on loci 57 kb, 30 kb, 5.87 kb, and 0.1 kb upstream and 1.48 kb, 3.84 kb, and 54 kb downstream around the pfdhfr locus. The dotted line crossing the y axis indicates the mean He at 10 neutral microsatellite markers on other chromosomes. (B) Selection patterns of pfdhfr alleles in Yunnan (black line) and Hainan (red line) are showed in the upper panel. A detailed description of the selection patterns in three sampling sites of Hainan is shown in the lower panel. The error bars indicate standard deviations (SD).

