
Figure 1.
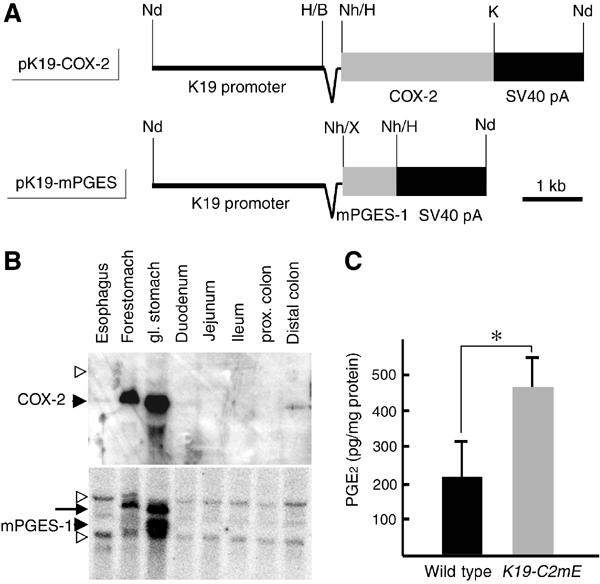
Expression of COX-2 and mPGES-1, and production of PGE2 in K19-C2mE stomach. (A) Transgenic vectors for COX-2 and mPGES-1 expression, respectively. Synthetic chimeric intron is indicated as a wedge-shaped line between the K19 promoter and each cDNA. Fragments of cDNAs and SV40 pA cassettes are indicated as gray and black boxes, respectively. Nd, NdeI; H, HindIII; B, BamHI; K, KpnI; Nh, NheI; and X, XbaI. (B) Northern blots for COX-2 and mPGES-1 mRNAs in the K19-C2mE mouse digestive tract. Filled arrowheads indicate the mRNA sizes for transgenic genes, whereas open arrowheads indicate the sizes for endogenous genes. The arrow on the bottom panel indicates the residual COX-2 band because of the reprobing of the same filter as the top. (C) PGE2 levels in the glandular stomach are presented as the mean±s.d. *P<0.05.