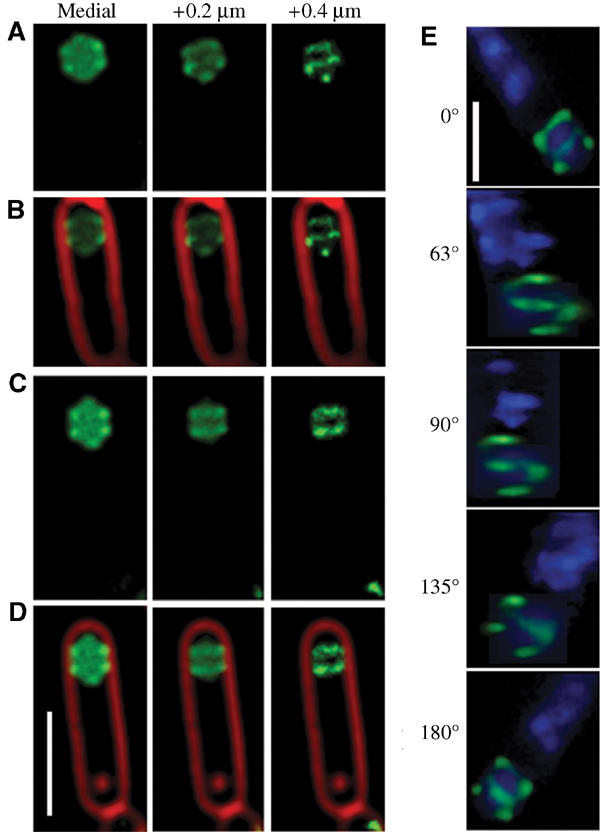
Figure 3.

Three-dimensional visualization of GFP-SpoIIQ rings after membrane fusion. Optical sectioning deconvolution microscopy was used to obtain images from different focal planes within the specimen (A–D) and used to reconstruct the three-dimensional model of GFP-SpoIIQ (E). In all, 20 images were obtained from focal planes 0.1 μm (A–D) or 0.15 μm (E) apart. (A–D) Different focal planes of GFP-SpoIIQ (green) from two sporangia, starting with the medial GFP focal plane (far left) and +0.2 and +0.4 μm. For reference, the medial focal plane of FM 4-64-stained membrane (red) is included as an overlay (B, D). (E) Three-dimensional model of GFP-SpoIIQ. Z-stacks each separated by 0.15 μm were loaded into the volume builder function of the Applied Precision SoftWorx program (version 3.3) with modeled projections around the Y-axis shown and DAPI-stained chromosomes shown as a reference point (also shown in the Supplementary movie). Scale bar, 2 μm.
