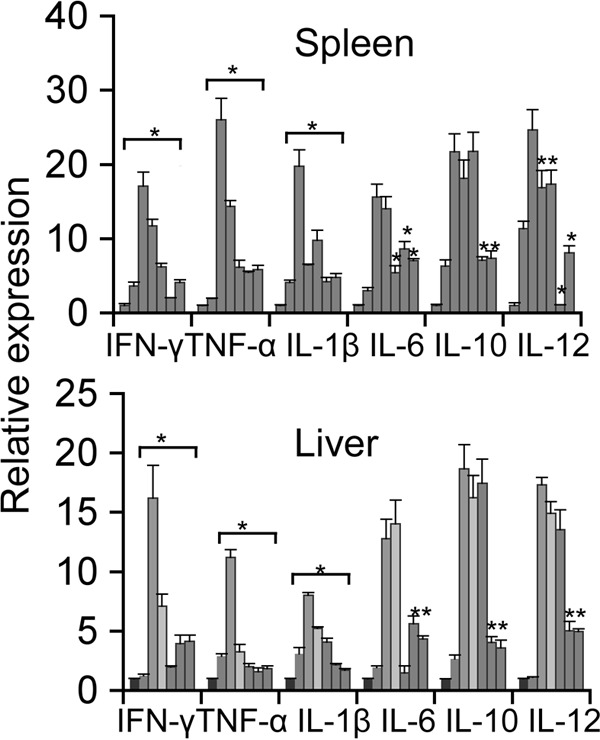
FIG 4.

Real-time PCR analysis of splenic and liver cytokine mRNA expression. Shown are relative levels of expression of cytokines in the (i) sham-infected control, (ii) hLF-injected, (iii) A. actinomycetemcomitans-injected, and (iv) hLF-pretreated A. actinomycetemcomitans-injected groups. Results for the (i) control, (ii) hLF-alone, (iii) bacterium-alone, (iv) hLF oral feeding, (v) prophylactic, (vi) therapeutic, and (vii) concurrent treatment groups were calculated by the cycle threshold (2−ΔΔCT) method using β-actin as an internal control. Results are shown as mean fold change ± SEM over uninfected controls. Asterisks indicate statistically significant difference compared to uninfected controls (P < 0.05), as calculated by Student's t test.
