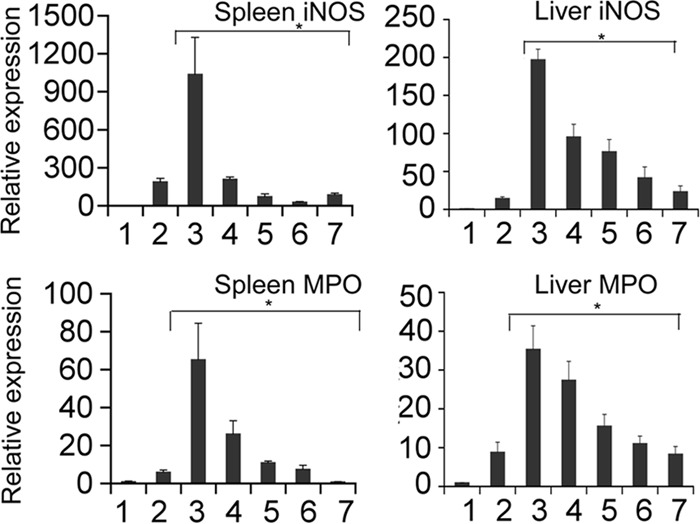
FIG 7.

Acute-phase iNOS and MPO gene expression during A. actinomycetemcomitans bacteremia in hLF-treated mice. The gene expression of iNOS and MPO from spleen and liver was calculated by using β-actin as an internal control. Results are shown as mean fold change ± SEM over uninfected controls. Asterisks indicate statistically significant difference compared to the uninfected control (P < 0.05), as calculated by Student's t test. The bars represent the following treatment groups: 1, control; 2, hLF alone; 3, bacteria alone; 4, hLF oral feeding; 5, prophylactic; 6, therapeutic; and 7, concurrent.
