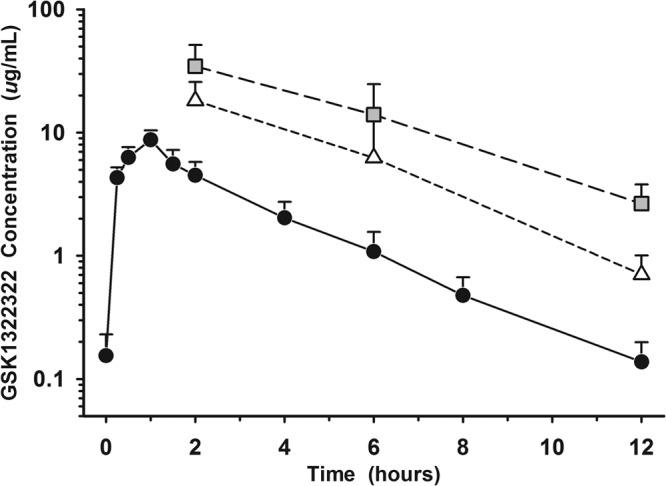
FIG 2.

Mean (± SD) concentration-versus-time profiles of GSK1322322 in plasma (unbound), epithelial lining fluid (ELF), and alveolar macrophages (AM) after repeat intravenous dosing of 1,500 mg twice daily. Closed circles represent unbound plasma, open triangles represent ELF, and gray squares represent AM. The y axis is in log scale.
