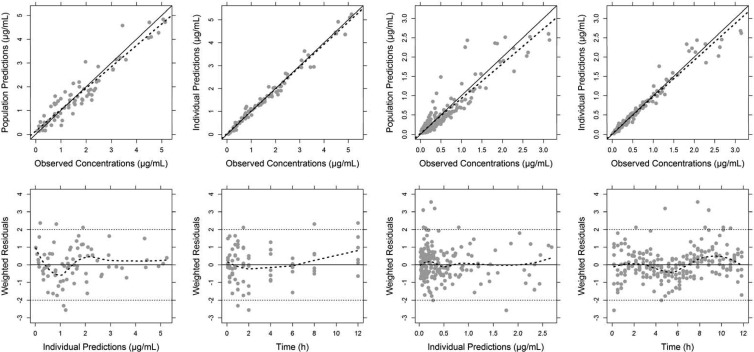
FIG 2.
Goodness-of-fit plots for the plasma (four panels on the left) and tissue data (four panels on the right) using a nonlinear mixed-effect modeling approach. The data were simultaneously fitted to a three-compartment body model with first-order elimination from the central compartment. In the observed versus model-predicted concentration plots (upper panels), the solid and dashed line indicate the linear regression fit and identity line, respectively, whereas in the residual plots (lower panels), a trend dashed line was added using the local polynomial regression fitting (Loess smooth) in R.

