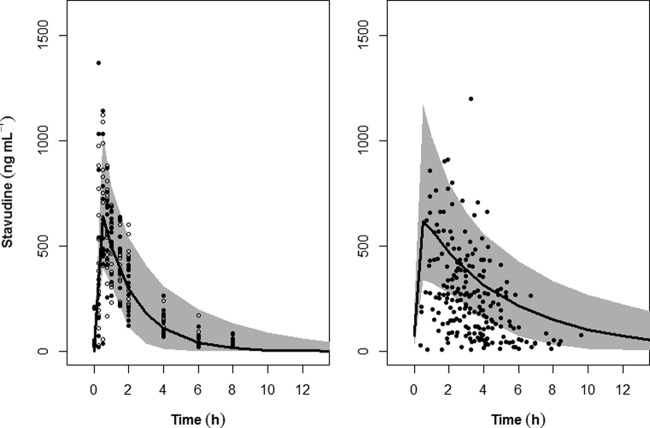
FIG 1.
Accuracy of the final model evaluated by visual predictive check obtained from 1,000 simulations in adult patients (left) and another 1,000 in pediatric patients (right) receiving 30 mg and 1.23 mg/kg stavudine, respectively. In the left panel, the filled circles and the open circles represent stavudine plasma concentrations in adult patients given intact capsules and opened capsules, respectively, while the data points in the right panel are from Jullien et al. (12). The shaded areas correspond to the 95% prediction interval, whereas the line represents the median of the simulated profiles.

