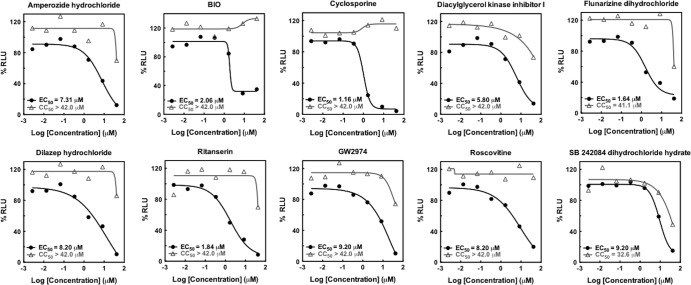
FIG 4.
Dose-dependent curves of primary-hit compounds with EC50s of <10 μM, efficacies of >70%, and CC50s of >30 μM from qHTS of the LOPAC. HCV inhibition (symbols and lines in black) was determined by Gluc activity and cytotoxicity (symbols and lines in gray) by ATPlite assay. The figures were plotted based on the results of nine 1,536-well plates of cultured LoxPGLuc cells infected with HCV-Cre and 7 serial dilutions (from 2.56 to 40 μM) of LOPAC compounds as described in Materials and Methods. Two sets of identically treated plates were used in the analyses, one for Gluc activity and the other for cytotoxicity by ATPlite assay.

