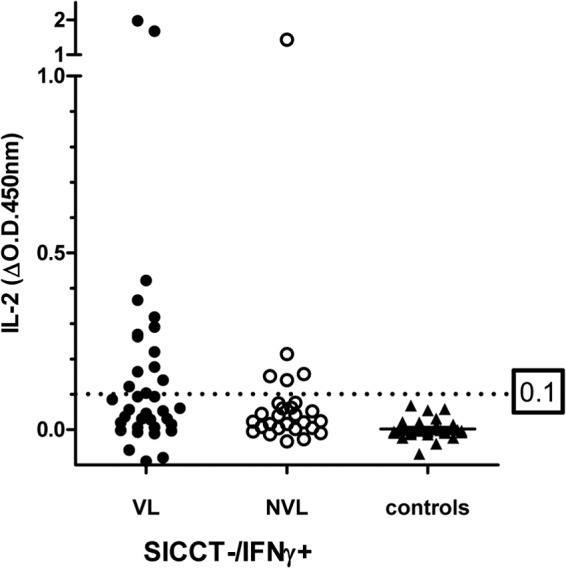
FIG 2.

PPDB-specific responses in naturally infected SICCT-negative/IFN-γ-positive reactor cattle (grouped into those with visible lesions [VL] and nonvisible lesions [NVL] at postmortem) and TB-free controls. Each spot represents a single animal. The 0.1-OD cutoff for optimal sensitivity/specificity (from ROC analysis of IL-2 data in Fig. 1) is shown.
