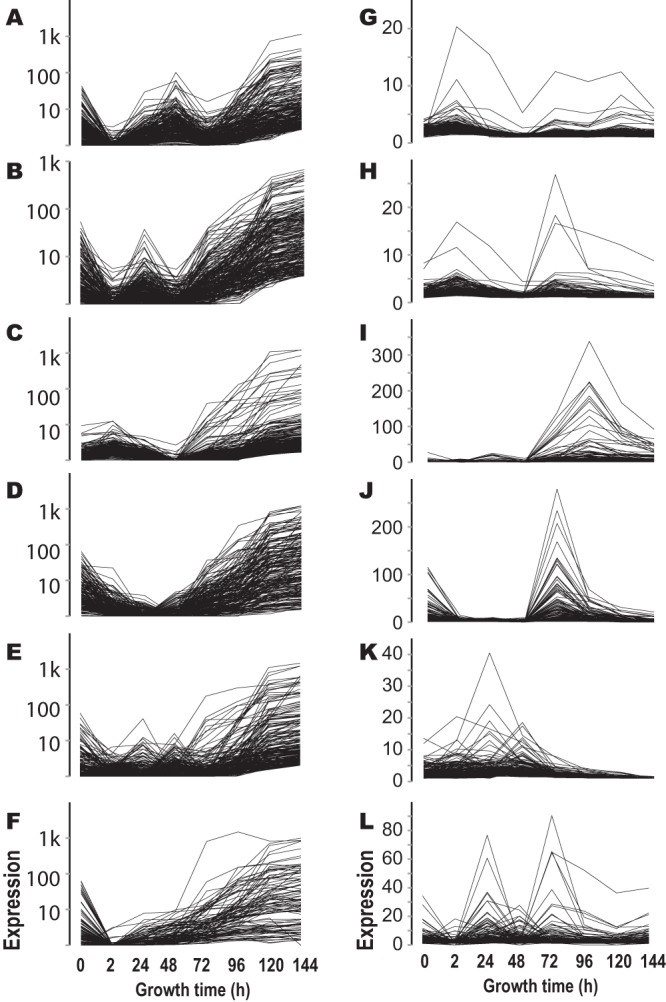
FIG 2.

Gene clusters based on relative expression across sexual development. About 60% of the genes in the N. crassa genome are continuously upregulated or downregulated during late perithecium development. Based on their expression profiles across earlier stages, these genes can be further classified into six upregulated clusters (A to F; y axis logarithmically scaled) and six downregulated clusters (G to L; y axis linearly scaled).
