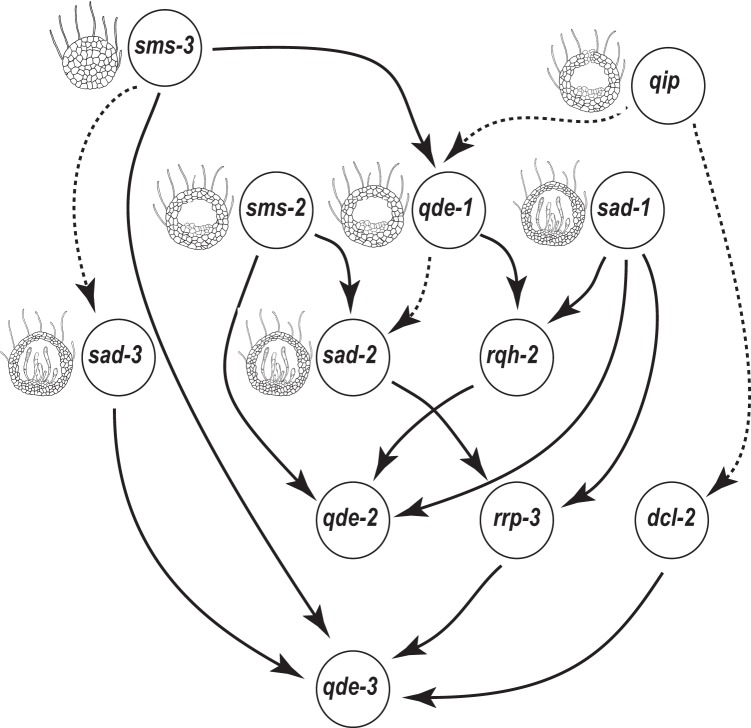
FIG 8.
Bayesian network inference for RNA silencing genes. Arrows indicate the dependence direction between two linked nodes (genes). Edges of posterior probability higher than 50% were present, and posterior probabilities >90% were in solid line. Illustrations of phenotypes were based on our observations, except for qip, which was drawn based on those of Hammond et al. (50), and sad-2, which was drawn based on those of Xiao et al. (76).

