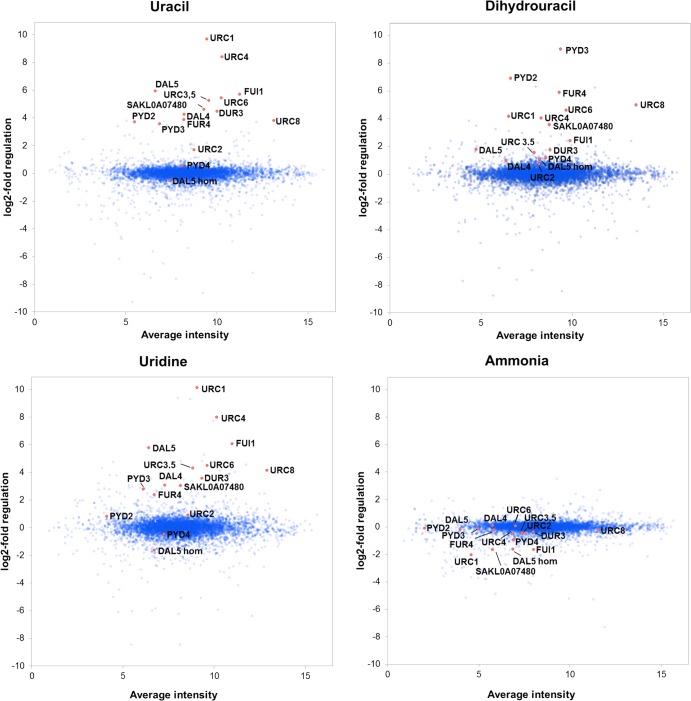
FIG 2.
Expression analysis of L. kluyveri grown on different nitrogen sources, as analyzed by microarrays. The oligonucleotides representing genes known to be involved in the URC and reductive pyrimidine catabolic pathways are marked in red. All of the genes selected for further analysis, which also are marked in the figure, were previously unknown but have expression patterns similar to those of the known URC genes or are homologous to a gene with a similar expression pattern. The exception is the FUI1 homolog SAKL0H03498g, which could not be identified among the oligonucleotides represented on the array. The y axis shows the sample/reference signal log2 ratio, and the x axis is the average intensity of the total signal for each oligonucleotide (average of the technical and biological replicates).

