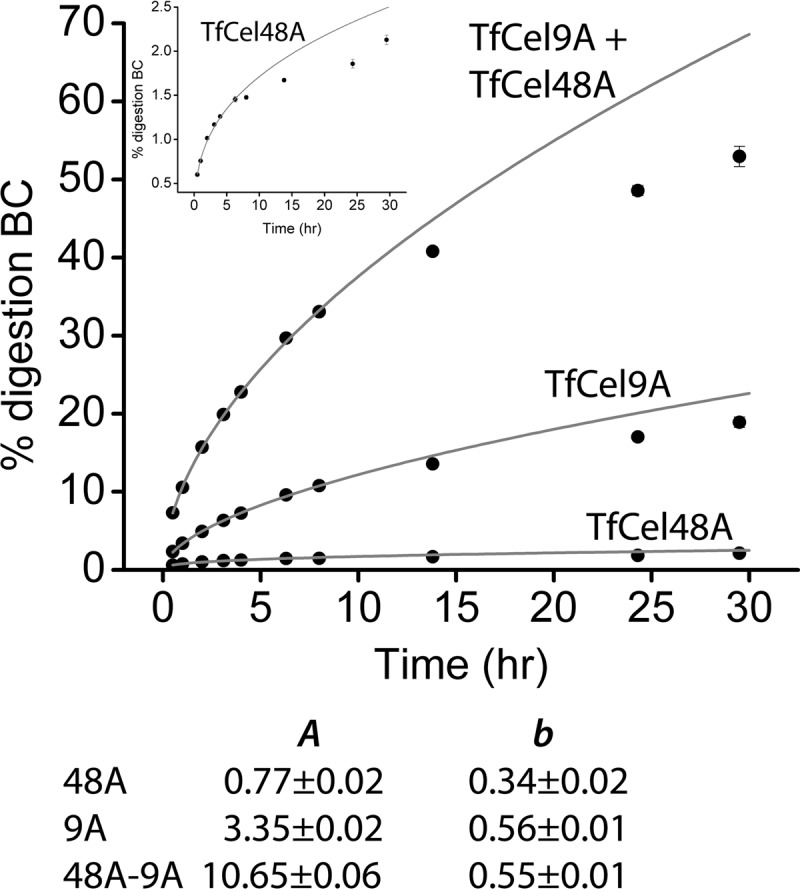
FIG 1.

Time course BC hydrolysis assays of 750 nM TfCel48A, 83 nM TfCel9A, and their mixture. (Inset) Magnification of the TfCel48A time course. All data points were obtained in triplicate, and the error bars represent 1 standard deviation. The table lists the A- and b-parameter values obtained by fitting the time course data to equation 1.
