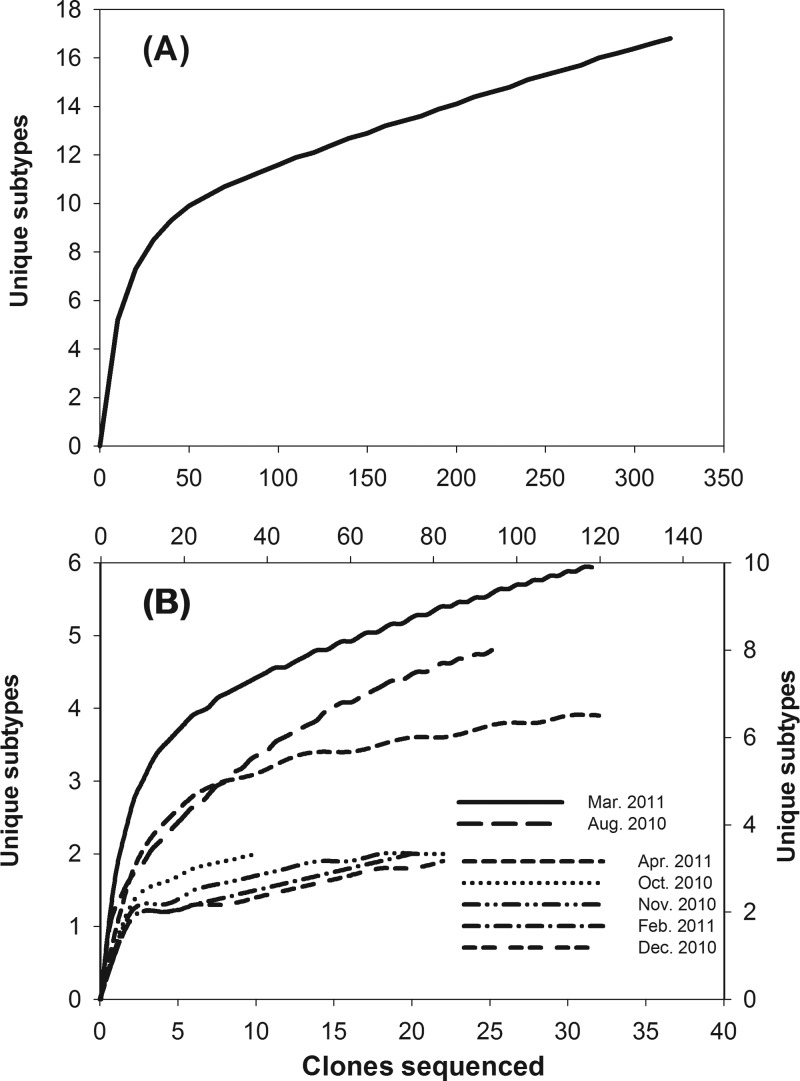
FIG 2.
Rarefaction curves of eae sequencing in all clone libraries combined (A) and in individual monthly clone libraries (B). In panel B, rarefaction curves for the March 2011 and August 2010 clone libraries use the top and right coordinates, while rarefaction curves for other clone libraries use the bottom and left coordinates.

