FIG 2.

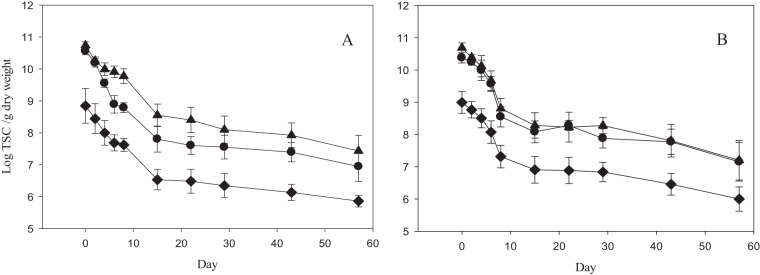
Decay curves for MST markers as a function of treatment (n = 18). Levels of CowM3 (◆), Rum-2-Bac (●), and GenBac (▲) in unshaded (A) and shaded (B) plots are shown. Error bars represent 95% confidence intervals.

Decay curves for MST markers as a function of treatment (n = 18). Levels of CowM3 (◆), Rum-2-Bac (●), and GenBac (▲) in unshaded (A) and shaded (B) plots are shown. Error bars represent 95% confidence intervals.