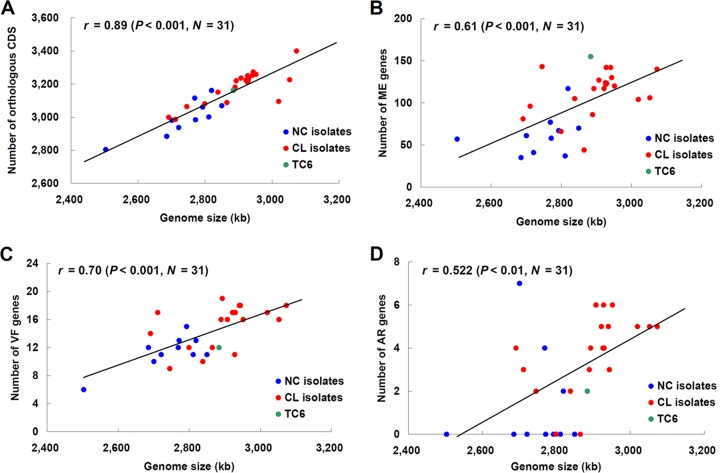
FIG 2.
Correlation of genome size with numbers of orthologous genes and clinically relevant genes in E. faecium. The numbers of orthologous CDS (A), ME genes (B), VF genes (C), and AR genes (D) in an individual strain are plotted against the genome size of that strain. Pearson's correlation coefficients and P values were calculated and are shown in each scatter plot. The color of each circle indicates NC isolates (blue), CL isolates (red), and a transconjugant (green).

