FIG 5.

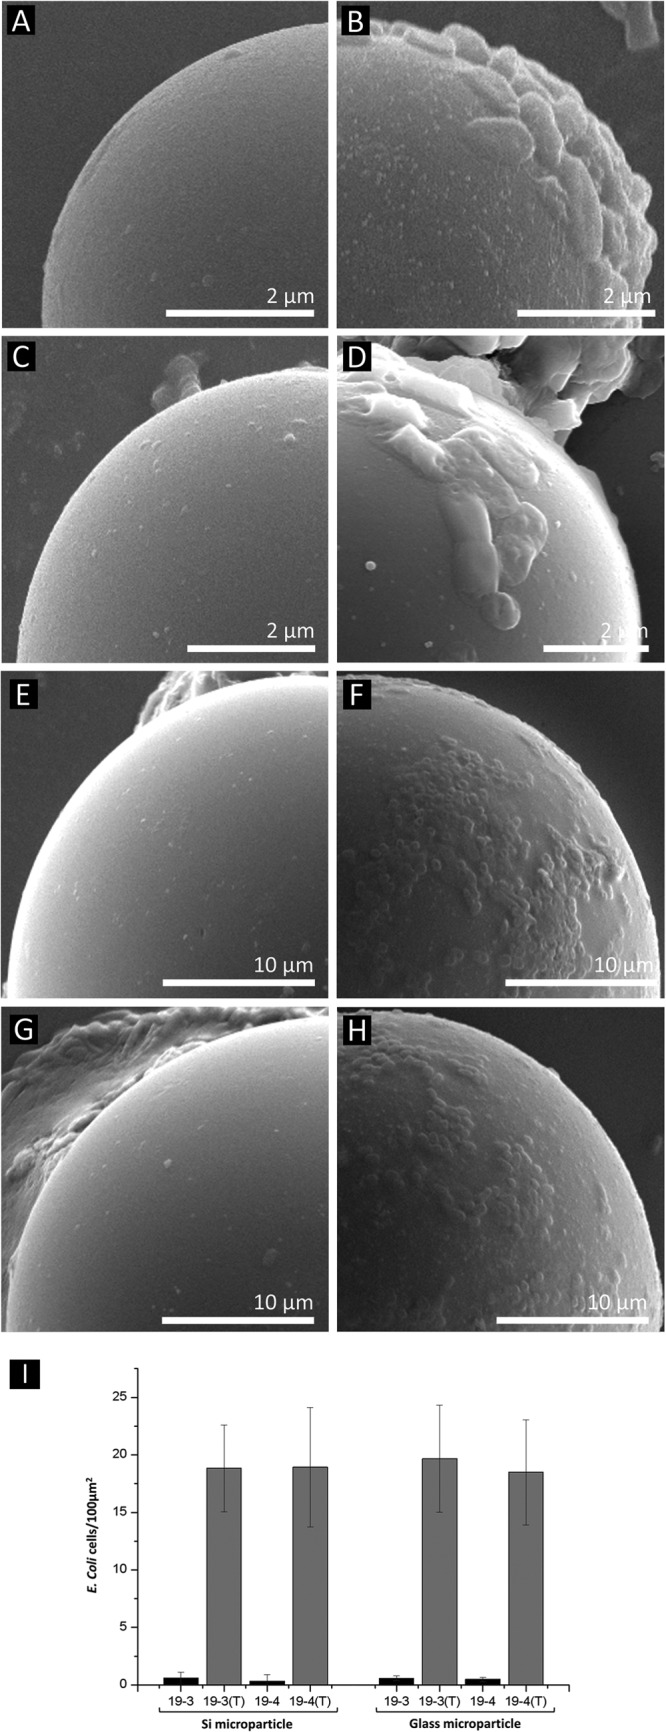
Cell adhesion test. A cell adhesion test was performed on silica microparticles (A, B, C, and D) and glass microparticles (E, F, G, and H). SEM analysis was used to observe the surfaces of the microparticles. The SEM images on the left are the control XL10-Gold harboring pOW19F-PerPA3 (A and E) and pOW19F-PerPA4 (C and G) without tyrosinase treatment. The SEM images on the right are tyrosinase-treated recombinant E. coli PerPA3-DOPA (B and F) and PerPA4-DOPA (D and H). Only catecholamine-displayed E. coli exhibited adhesive properties. (I) The cells adhered onto the microparticles were quantified and expressed as cells per area in the bar graph. 19-3 and 19-4 denote recombinant E. coli strains harboring pOW19F-PerPA3 and pOW19F-PerPA4, respectively. Tyrosinase-treated cells are labeled with a “(T)”.
