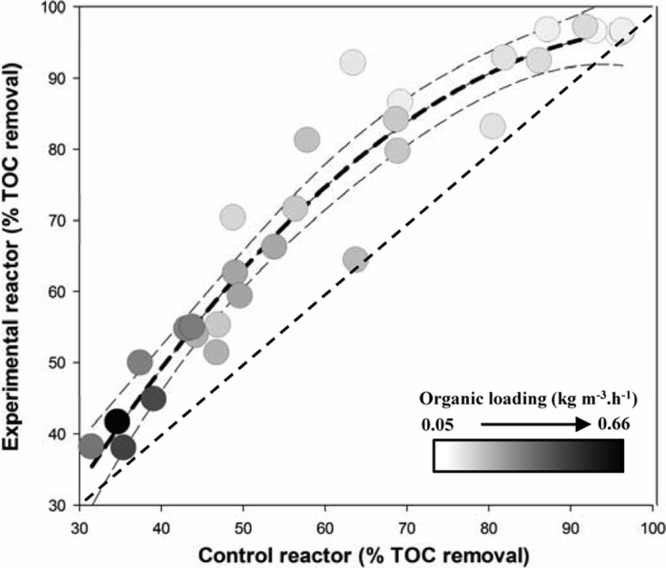
FIG 2.

Comparison of TOC removal efficiencies of the test reactor (y axis) and control reactor (x axis) with the same organic loadings (according to the color gradient). A total of 25 different organic loadings were tested, and the organic loadings ranged from 0.05 to 0.66 kg m−3 h−1. The black dotted line is the quadratic regression curve of the data, and the dotted gray lines are the 95% confidence bands of regression. The gray gradient within the symbol indicates organic loading rates.
