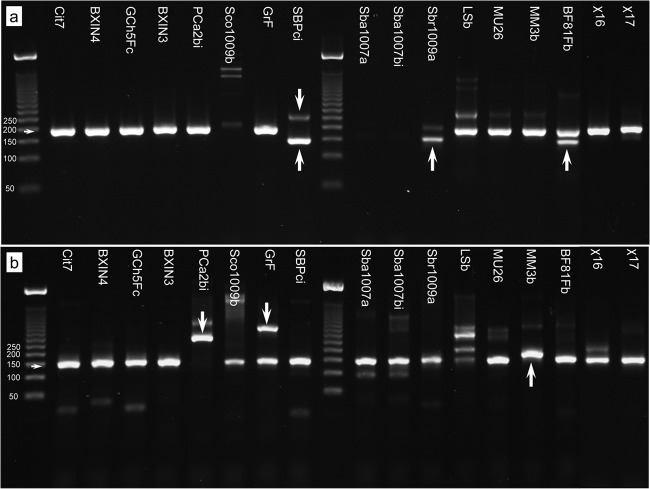
FIG 3.
Comparison of qPCR performance for primer pairs 3308f/3463r (a) and 3341fb/3462r1 (b). Horizontal arrows indicate the sizes of intended products, upward-pointing arrows show unintended but workable misprimes off the ina gene, and downward-pointing arrows show confounding misprimes off other genes.

