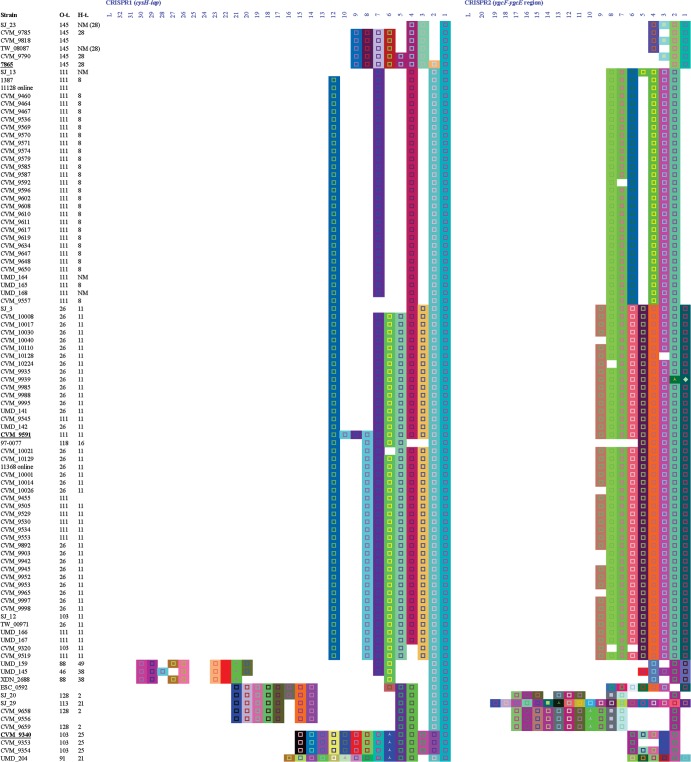
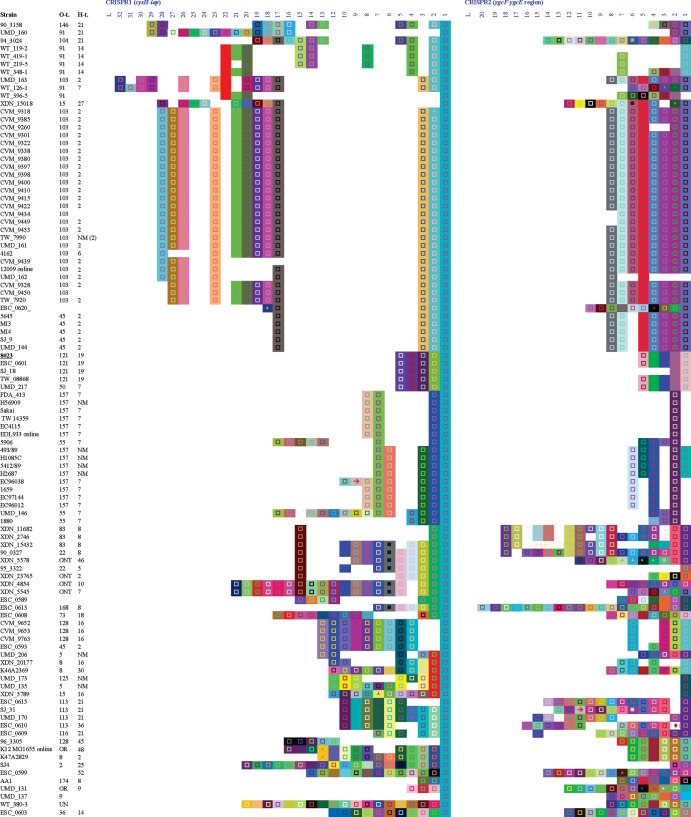
FIG 1.
CRISPR1 and CRISPR2 arrays of STEC strains. The left block represents CRISPR1 and the right block represents CRISPR2 for the same strains in the same order. Only spacers are shown and are represented by colored squares. A same color/figure combination represents identical nucleotide sequence. Spacers on the right are older than those on the left. Column L indicates the leader sequence position. Strains underlined and in boldface type are anchor strains. Sequences were extracted by using a proprietary macro designed by DuPont (28). The same software was used for the representation of spacers and repeats. Except for E. coli K-12, all 194 strains were STEC (stx1, stx2, or stx1 and stx2 positive). t., type; NM, nonmotile; OR and ONT, O-antigen nontypeable; UN, nontypeable.


