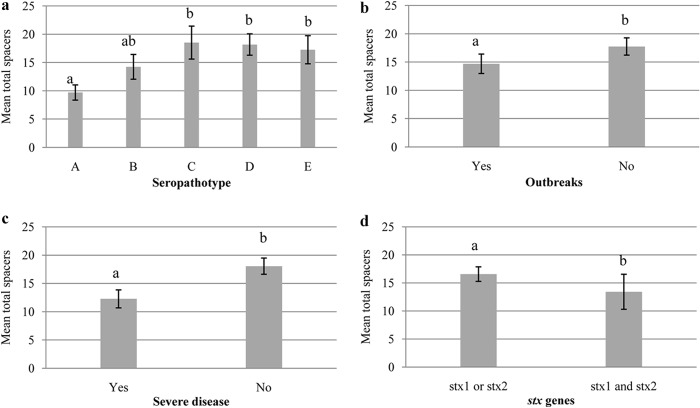
FIG 2.
Association of total spacer content with seropathotype, the ability to cause outbreaks and severe disease, and stx genes. Bars represent total spacer counts (CRISPR1, CRISPR2a, CRISPR2b, CRISPR3-4, CRISPR3, and CRISPR4). (a) Seropathotypes A to E; (b) potential ability to cause an outbreak; (c) potential ability to cause severe disease based on the classification of Karmali et al. (4); (d) stx genes. Vertical lines represent ±2 standard errors. Statistical tests revealed significant differences (P < 0.05) between seropathotypes and between the ability to cause outbreaks and severe disease and stx gene content (P < 0.05). Different letters above the bars indicate significant differences.

