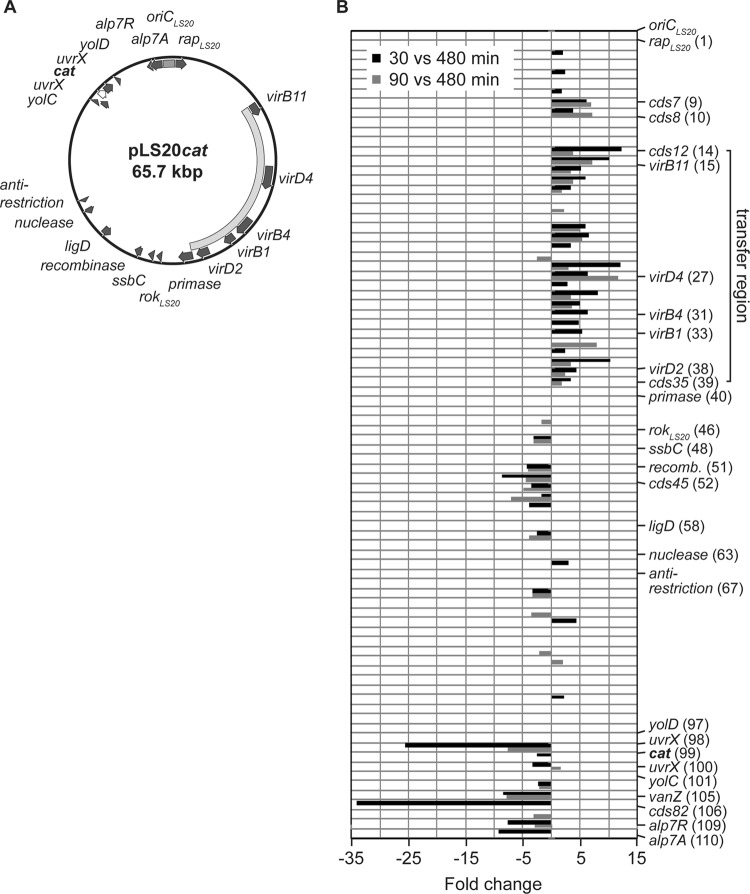
FIG 4.
Transcriptome analysis of the conjugative plasmid pLS20. (A) Circular map of plasmid pLS20cat. Genes showing significant homologies to genes with known or identified functions are illustrated as arrows in dark gray. The transfer region responsible for the conjugative ability of pLS20 is indicated by a curved bar in light gray and the origin of replication of the plasmid (oriCLS20) by a gray bar. The cat gene marked in boldface and shown as a white arrow with a black outline was inserted via the unique SalI restriction site on pLS20, interrupting the uvrC gene (14). (B) Transcriptional profile of genes carried by pLS20 correlated with their linear location on the plasmid for two different time points during exponential growth. Displayed are the expression ratios as fold changes (P < 0.3) of RNA derived from early exponential growth (30 versus 480 min; black bars) and of RNA derived from mid-exponential growth (90 versus 480 min; gray bars) compared to RNA derived from stationary phase. The putative transfer region is indicated by a solid line and comprises the conserved core components virB1, virB4, virB11, virD2, and virD4 found on pLS20. Additionally, genes already indicated in panel A and genes which are significantly altered in their expression and described in the text were also included in the figure. Numbers in parentheses correspond to the locus tags of the NCBI reference sequence NC_015148.1.

