
FIG 2.
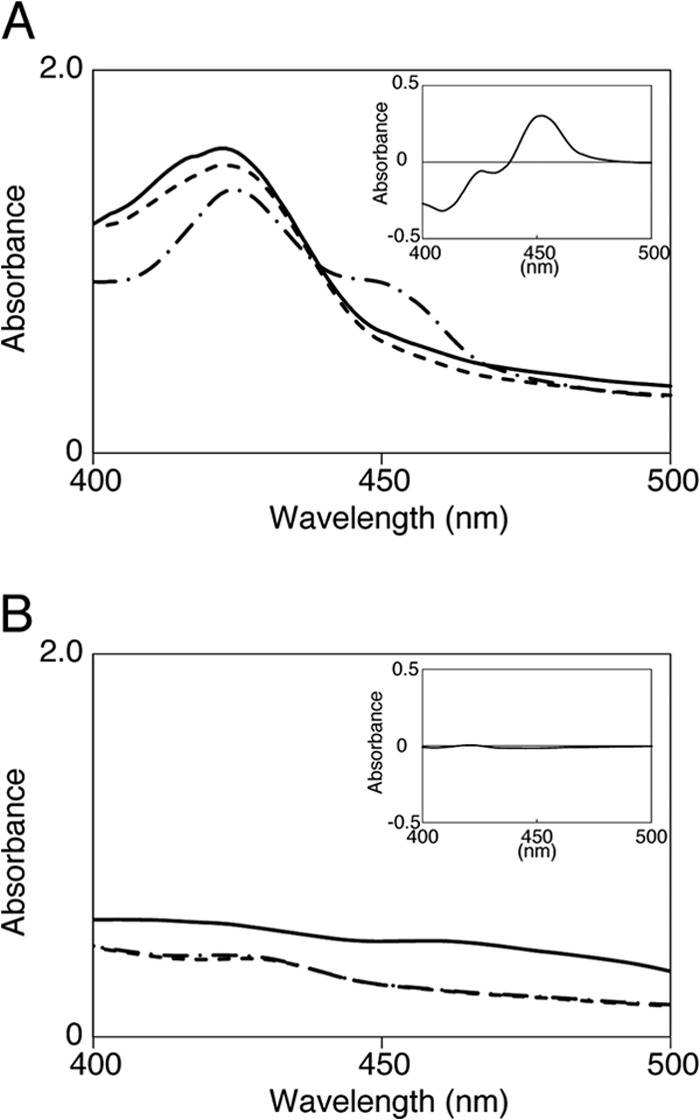
Spectral analysis of CYP154-RED. (A) Spectral features of the recombinant CYP154C3 fused C terminally with the P450 reductase domain of P450Rhf (CYP154-RED) in the cell extract. Spectra are shown for the oxidized (solid line), sodium-hydrosulfite-reduced (dashed line), and CO-bound (chain line) forms of the enzyme. The CO difference spectrum is shown in the inset. (B) Negative-control experiment using the cell extract of E. coli harboring pRED.