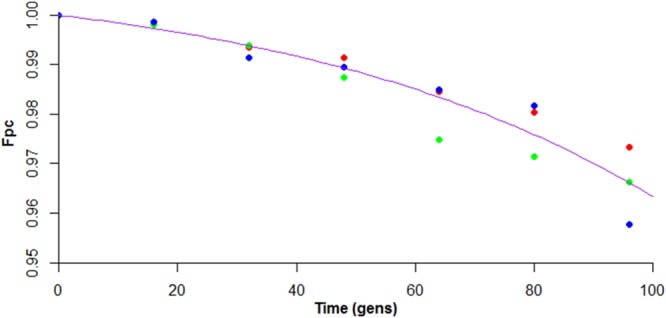
FIG 2.

Graph depicting the high stability of pC3H111. The fraction of cells containing pC3 (Fpc) was plotted against time (in generations [gens]). The data points are colored in red, blue, or green according to replicates, and the line of best fit is shown in purple.
