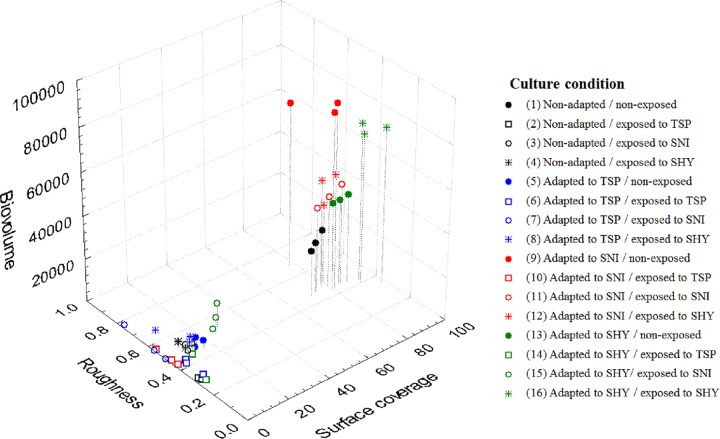
FIG 2.
Relationships between biovolume (μm3), surface coverage (%), and roughness of biofilms produced by E. coli ATCC 12806 adapted and/or exposed to sublethal concentrations of food-grade biocides. Data are the averages for three determinations. For additional interpretation, see the legend to Fig. 1.

