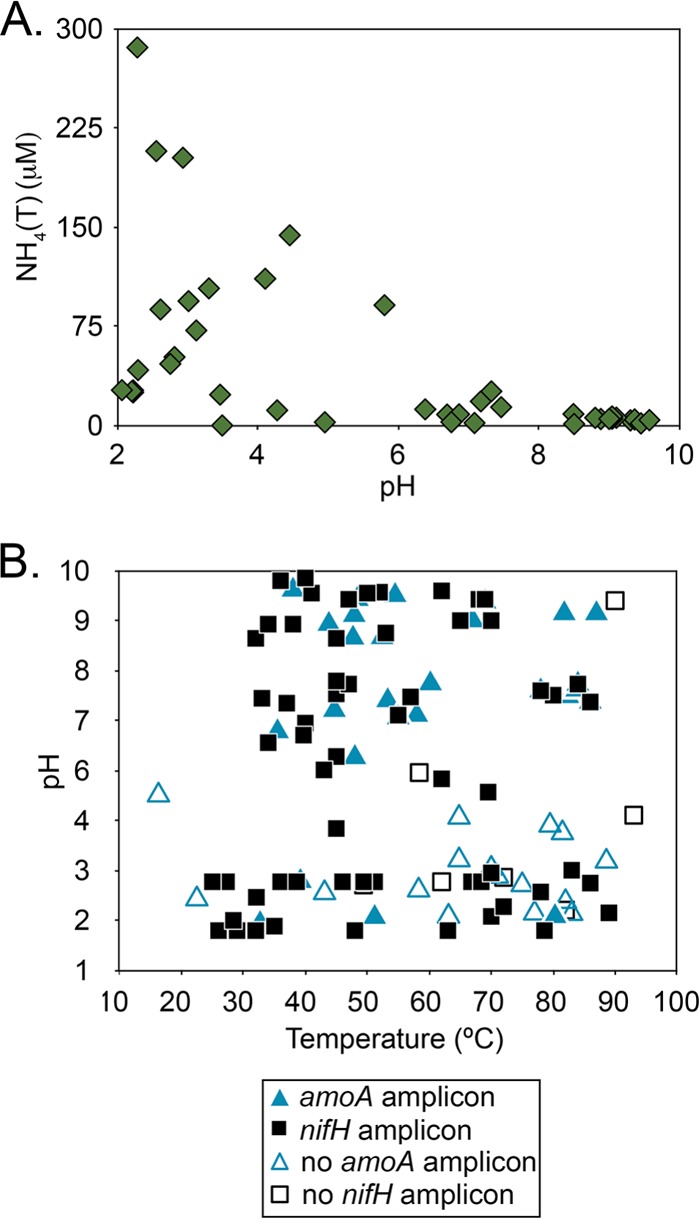
FIG 1.

(A) NH4(T) concentrations in YNP geothermal springs plotted as a function of pH (data extrapolated from reference 17). (B) Distribution of nifH and amoA in mat and sediment samples from YNP geothermal springs plotted as a function of spring water temperature and pH, as compiled from previous reports (17, 20). Closed triangles (amoA) and closed squares (nifH) indicate sites where PCR amplicons were detected, and open triangles (amoA) and open squares (nifH) indicate sites where PCR amplicons were not detected.
