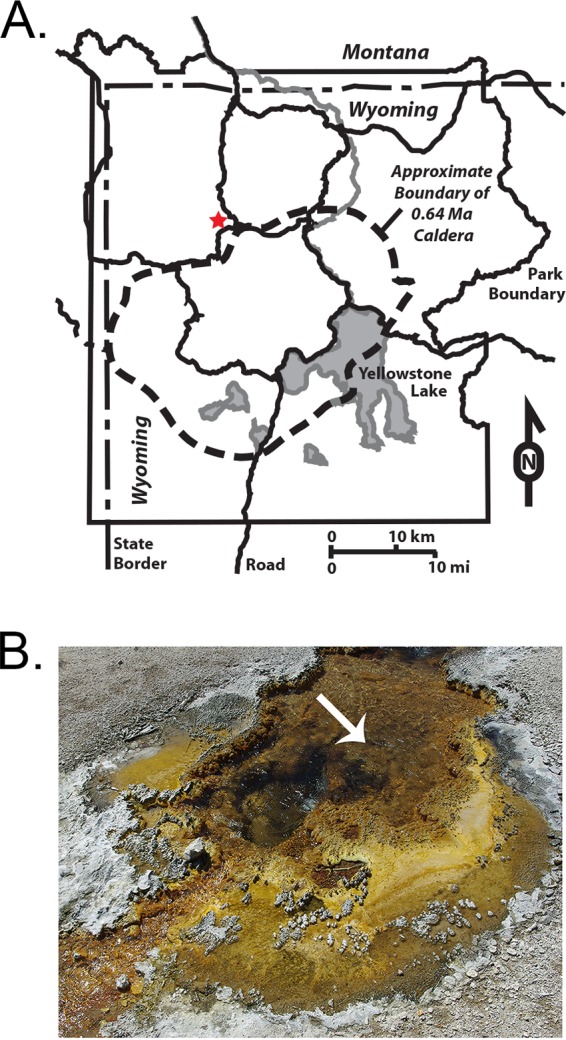
FIG 2.

Map of the overall sampling location (A) and the location of the experimental site at PS, YNP (thermal ID NBB 113) (B). The red star indicates the approximate location of PS (A), and the white arrow indicates the sampling location at PS (B). Panel A is based on a map from the U.S. National Park Service.
