
FIG 4.
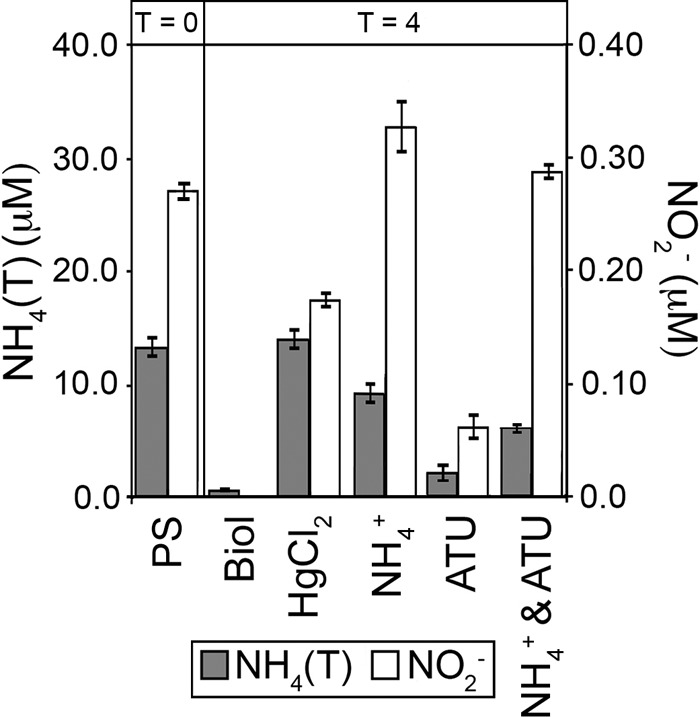
Concentrations of NH4(T) (gray bars) and NO2− (white bars) in microcosm assays. NO2− concentrations are plotted on the secondary y axis. The PS treatment reflects the starting concentrations of NH4(T) and NO2− in PS spring water in each microcosm prior to amendment (time zero). All other values were measured at 4 h postamendment. Abbreviations: Biol, unamended control; NH4+, NH4(T) added as NH4Cl (1 mM final concentration); ATU, ATU added to a final concentration of 1 mM; HgCl2, HgCl2 added to a final concentration of 500 μM.