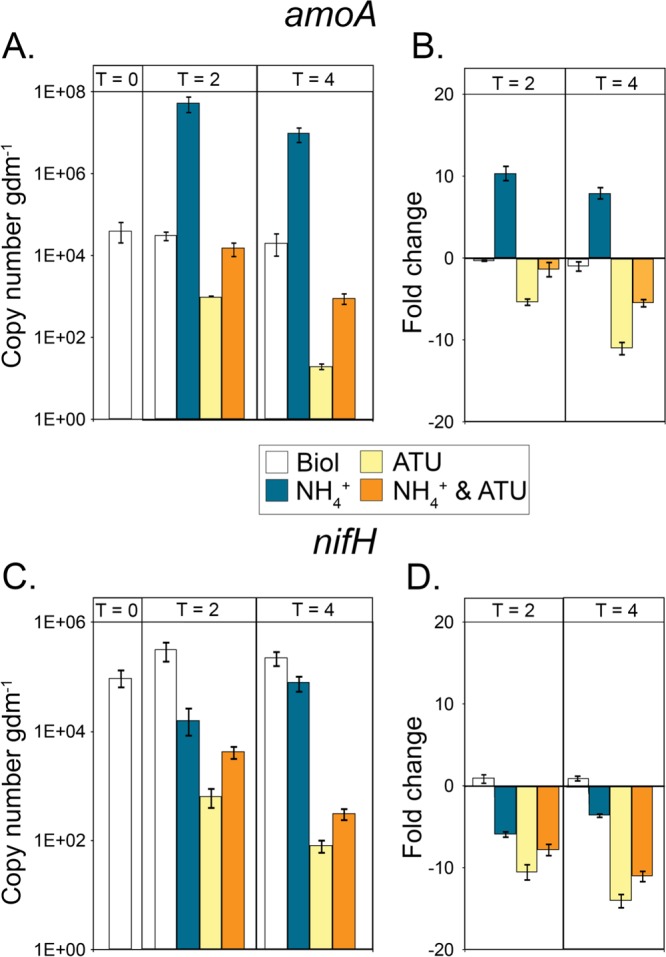
FIG 5.

Transcript abundance and fold changes (log2) in amoA (A and B) and nifH (C and D) transcript abundance in microcosms containing sediments from the source of PS. Sediment samples were taken from replicate microcosms at time zero (sediments taken directly from the spring source) and at 2 and 4 h postamendment. Error bars represent the standard deviations of qRT-PCR assays performed in triplicate. Abbreviations: Biol, unamended control; NH4+, NH4(T) added as NH4Cl to a final concentration of 1 mM; ATU, ATU added to a final concentration of 1 mM.
