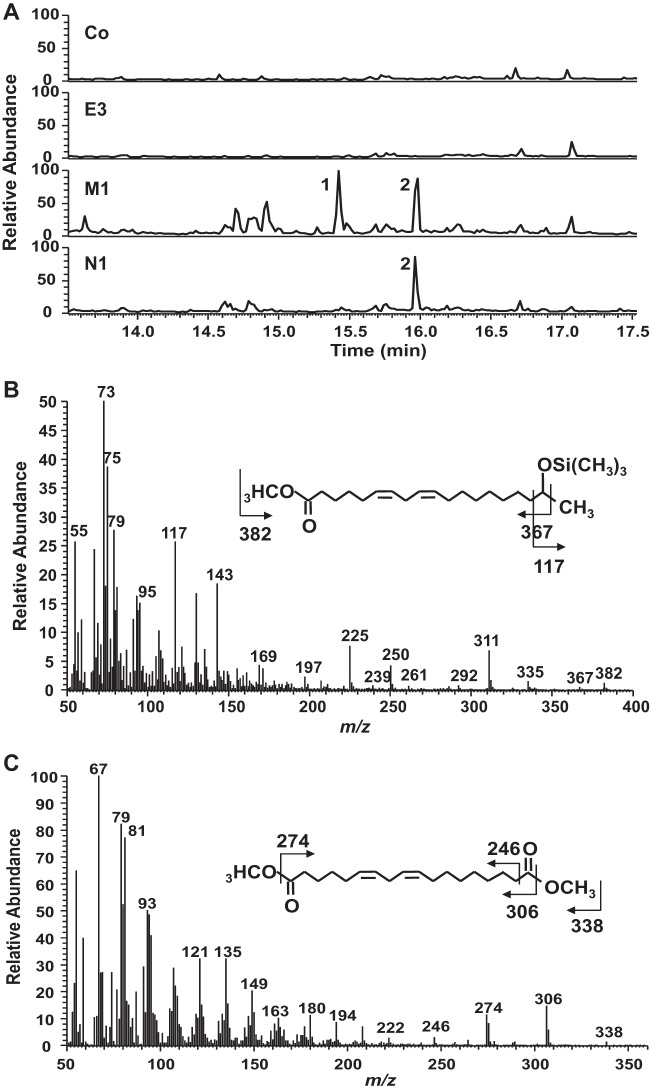
FIG 3.
GC-MS analysis of products formed by incubation of linoleic acid with control (Co) or CYP52E3 (E3)-, CYP52M1 (M1)-, and CYP52N1 (N1)-transformed cells using the resting cell system. (A) Total-ion chromatogram. The mass spectra of peaks 1 and 2 yield fragmentation patterns identical to those of 17-hydroxy linoleic acid (B) (21) and 18-carboxy linoleic acid (C) (22).

