
FIG 2.
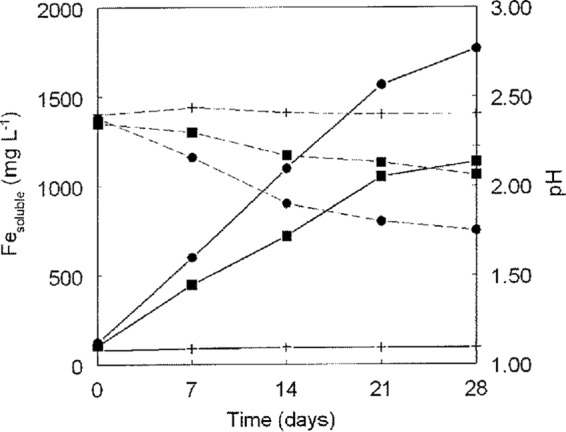
Comparison of pyrite oxidation by “F. myxofaciens” P3G and that by the A. ferrooxidans type strain, showing changes in soluble iron concentrations (solid lines) and pH (broken lines). Symbols: ■, “F. myxofaciens” P3G; ●, A. ferrooxidans type strain; +, abiotic controls. Data points are mean values of duplicate cultures, and error bars (where visible) depict data ranges.