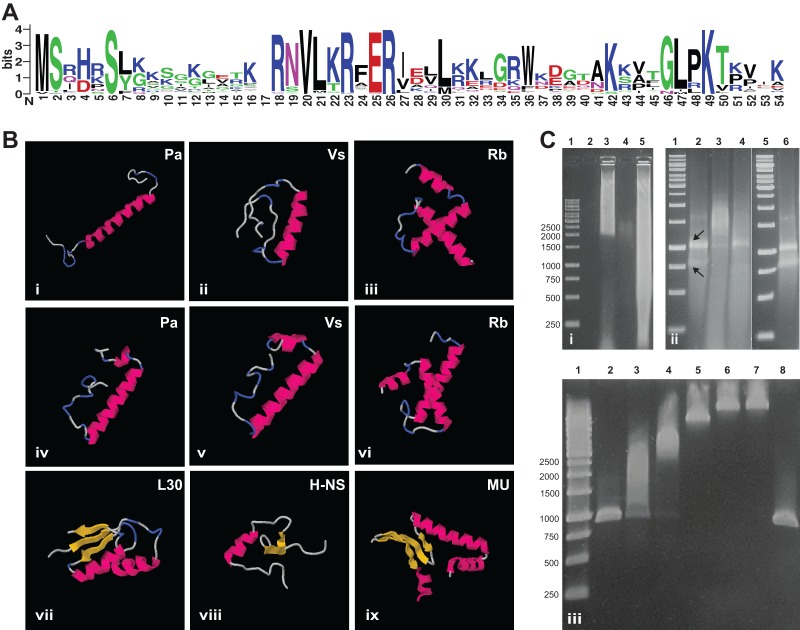
FIG 1.
Features of the PVC superphylum SP. (A) Conservation of the SP amino acid sequence. A sequence logo based on a MUSCLE alignment of all of the known SPs generated by WebLogo 3 is shown (28, 48). The overall height of the alignment positions indicates sequence conservation, while the height of each symbol indicates the relative frequency of each amino acid at the respective position. Symbol colors reflect amino acid chemical properties. Highly conserved positions can be observed along the complete length of the alignment, with a longer conserved region in the middle, corresponding to a predicted α-helix. (B) Predicted secondary and tertiary structures of representative SPs compared to those of small DNA/RNA binding proteins of E. coli. Predictions were performed with I-TASSER (49) (i to iii) and the QUARK server (50) (iv to vi). Structures: i and iv, SP of Protochlamydia amoebophila. UWE25 (GenBank/EMBL/DDBJ accession number YP_008052); ii and v, SP of V. spinosum (WP_009960041); iii and vi, SP of R. baltica (KF733603); vii, E. coli ribosomal protein L30 (Protein Data Bank accession number 2AW4); viii, E. coli DNA binding protein H-NS (Protein Data Bank accession number 1HNS); ix, E. coli histone like protein HU (Protein Data Bank accession number 1MUL). Pink, alpha-helix; yellow, beta-sheet; blue, turn; gray, unstructured. Independently of the software, a central alpha-helix is predicted for all of the SPs. The SP of all of the Planctomycetes shows a C-terminal lysine-rich extension that forms additional secondary-structure elements. (C) Nucleic acid mobility retardation by SP of R. baltica and P. amoebophila. Agarose gel i, retardation assay with sheared genomic DNA. Lanes: 1, molecular size markers; 2, empty; 3, genomic DNA with GST-tagged SP of R. baltica, 4: GST-tagged SP of R. baltica without DNA; 5, genomic DNA only. Agarose gel ii, retardation assay with purified total RNA. Lanes: 1 and 5, molecular size markers; 2, RNA only; 3, RNA with GST-tagged SP of R. baltica; 4, RNA with GST-tagged SP of P. amoebophila; 6, RNA with GST only. Arrows indicate bands representing the 16S and 23S rRNAs, respectively. (Bottom agarose gel) retardation assay with PCR products. Lanes: 1, molecular size markers; 2, only PCR product; 3 to 7, PCR product with increasing concentrations of GST-tagged SP of P. amoebophila; 8, PCR product with GST only. The same molecular size marker was used in all of the experiments, and fragment sizes in base pairs are shown on the left. The retardation assays suggest unspecific binding of SP to DNA and RNA.

