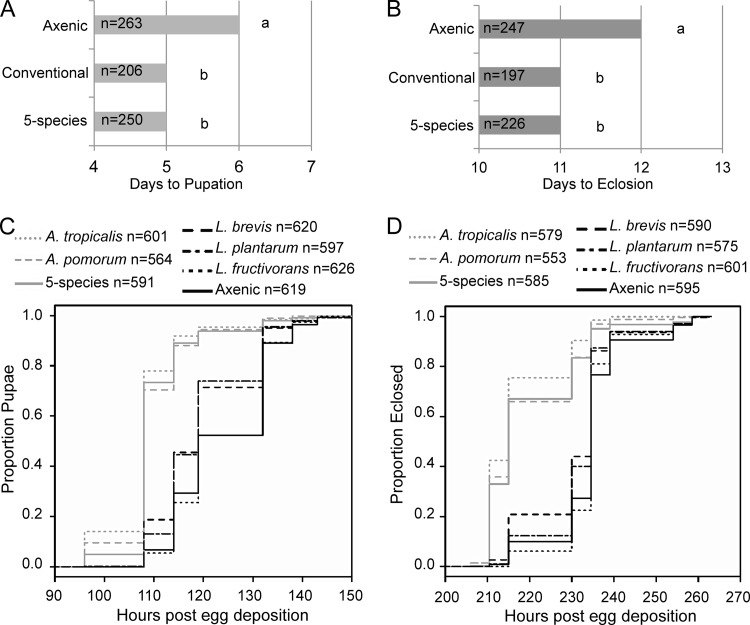
FIG 1.
Gut microbiota impact Drosophila development. (A and B) Times to pupation (A) and to eclosion (B) are shown in days post-egg deposition. The median of medians from 8 independent experiments is displayed, with n indicating the total number of observations. Different letters to the right of the bars indicate statistically significant differences by the Mann-Whitney test at a P value of <0.05. (C and D) Kaplan-Meier plots of times to pupation (C) and eclosion (D), respectively, with a key above indicating the treatments compared and number of observations (n) for each treatment.

