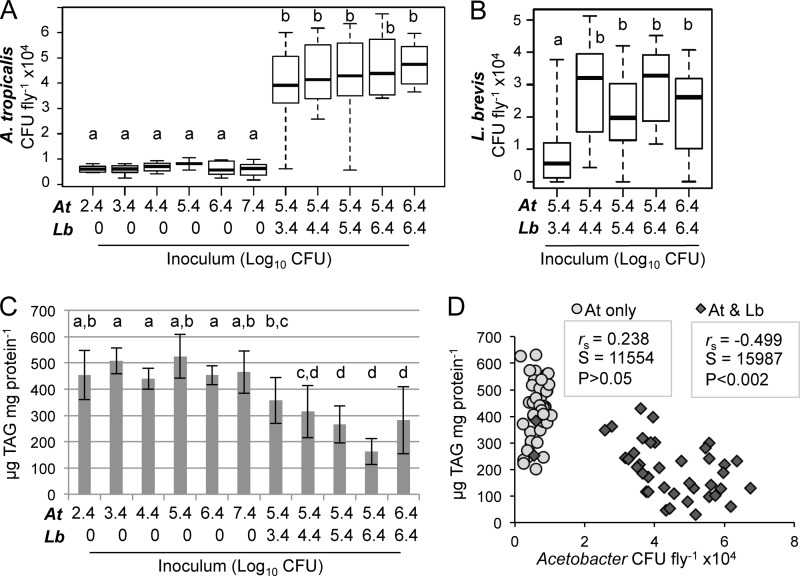
FIG 6.
Effect of bacterial inoculum on Acetobacter abundance and host triglyceride content. (A and B) A. tropicalis (A) and L. brevis (B) abundance are shown on a linear scale for the indicated gnotobiotic treatments. Treatments consisted of A. tropicalis (At) alone or in combination with L. brevis (Lb); the approximate number of cells added per vial is indicated at the bottom using a Log10 scale. Each box delineates the first and third quartiles, the dark line is the median, and the whiskers show the range from 3 independent experiments with 5 to 9 replicates each. Treatments that do not share a letter had significantly different results by Mann-Whitney test at a P value of <0.05 after Bonferroni correction. (C) Whole-fly triglyceride (TAG) content for the samples whose CFU counts are shown in panels A and B. Treatments that do not share a letter above the bars had significantly different results by Tukey's HSD test at a P value of <0.05, implemented with a linear mixed-effects model treating experiment as a random effect and corrected for multiple comparisons. (D) Correlation between A. tropicalis abundance and TAG content in the experiment whose results are shown in panel A; values are matched on the basis of vial, and correlation statistics are from Spearman's rank order test.

