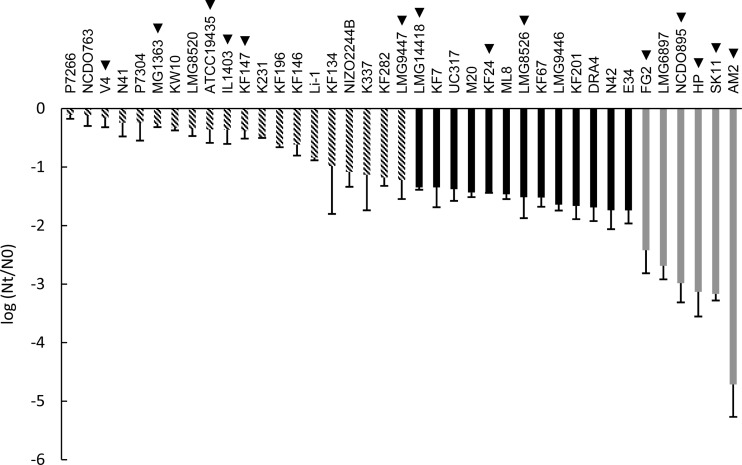
FIG 2.
Robustness of L. lactis strains upon oxidative stress exposure expressed as the difference between log CFU/ml after oxidative stress (Nt) and control (N0). For genotype-phenotype matching, groups were made up of robust (striped bars), intermediate (black bars), and sensitive (gray bars) strains. Strain names indicated with a triangle represent strains that were selected for the spray drying analysis (see Fig. 4). The data represent averages of two biological replicates. Error bars indicate standard deviations.

