
FIG 2.
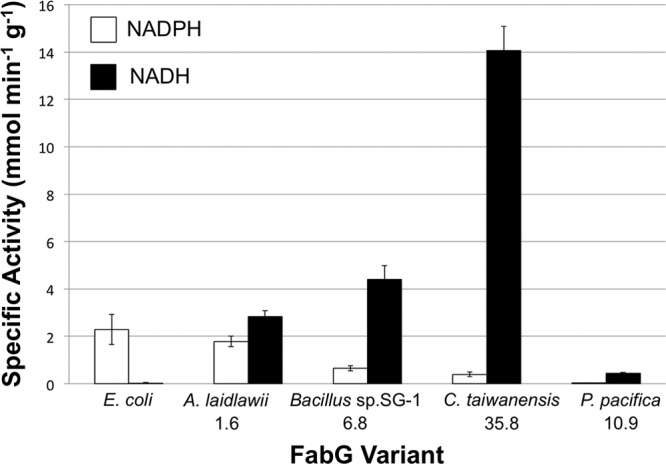
Specific activity of FabG homologs from E. coli and other species toward acetoacetyl-CoA. The number below each species name is the ratio of activity with NADH to activity with NADPH. E. coli FabG was essentially inactive with NADH. Bar heights represent average activities from 3 replicates, and error bars represent 1 standard deviation.