
FIG 3.
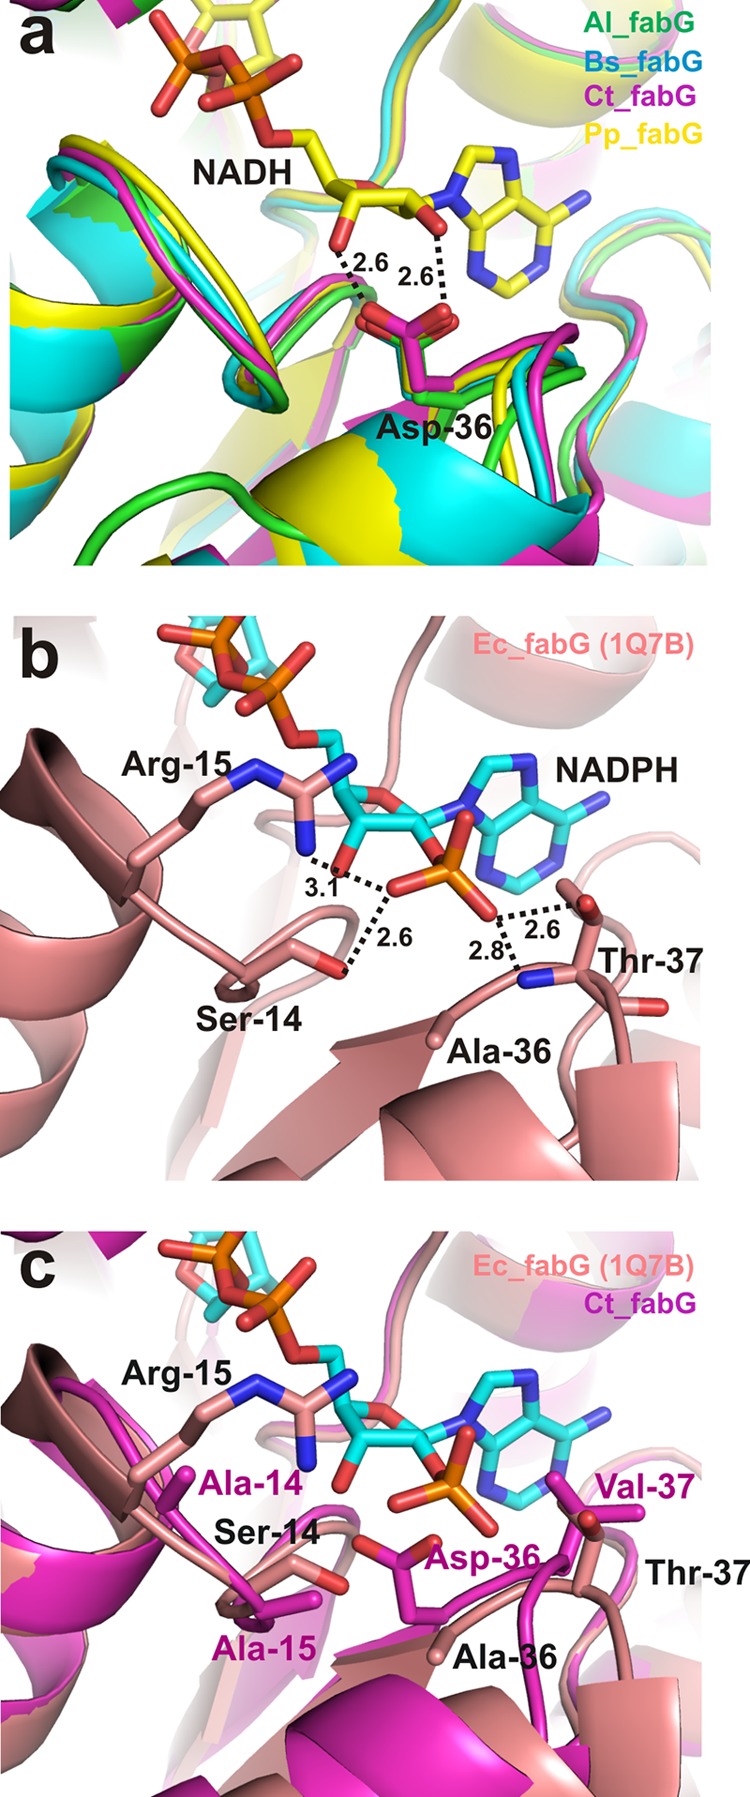
Comparison of cofactor-binding sites in FabG homologs. (a) Structural overlay of the Al_FabG, Bs_FabG, Ct_FabG, and Pp_FabG homologs with NADH. (b) Residues interacting with NADPH in the E. coli FabG (Ec_FabG) crystal structure. (c) Overlay of E. coli and Ct_FabG, depicting the clash that occurs between the NADPH 2′-phosphate and Asp36 (E. coli numbering) of Ct_FabG. Dotted lines represent ionic and polar interactions. Numbers represent distances between atoms in angstroms.