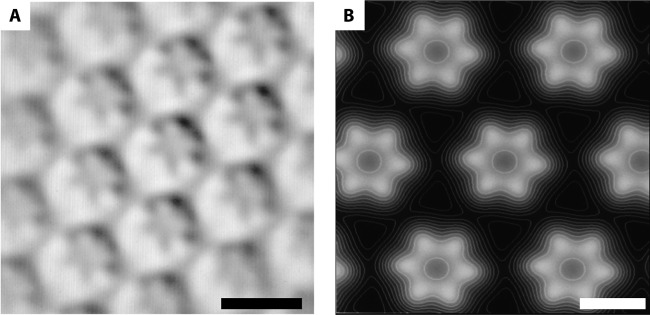
FIG 3.

The S-layer of “Ca. Kuenenia stuttgartiensis” visualized by image processing. (A) Correlation averaging shows that the S-layer of “Ca. Kuenenia stuttgartiensis” has hexagonal symmetry with a unit cell consisting of six protein densities surrounding a central pore. Scale bar, 20 nm. (B) Relief reconstruction gives an impression of the surface of the S-layer in three dimensions. White represents high and black represents low areas. Scale bar, 10 nm.
