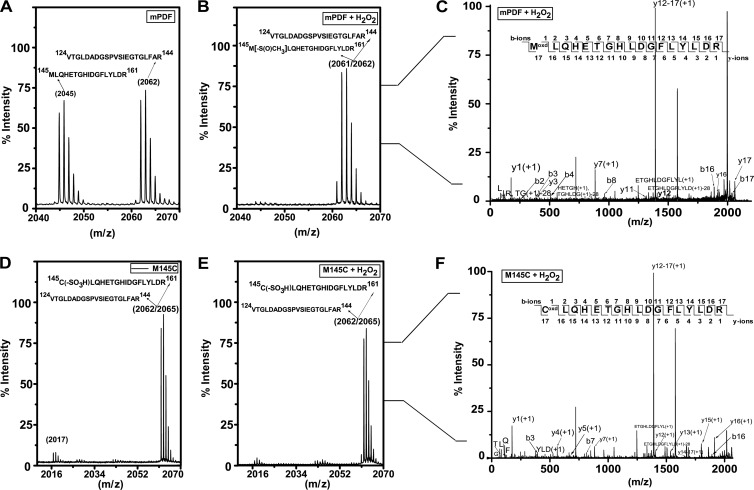
FIG 4.
Mass spectroscopy of M145C protein. (A, B, D, and E) MALDI analysis following trypsin digestion of mPDF (A and B) and M145C (D and E) proteins before and after H2O2 treatment, respectively. Fragment m/z values and corresponding amino acid sequences are indicated. (C and F) MS/MS spectra of oxidized methionine (C)- and cysteine (F)-containing peptides. b and y ions are indicated by arrows.

