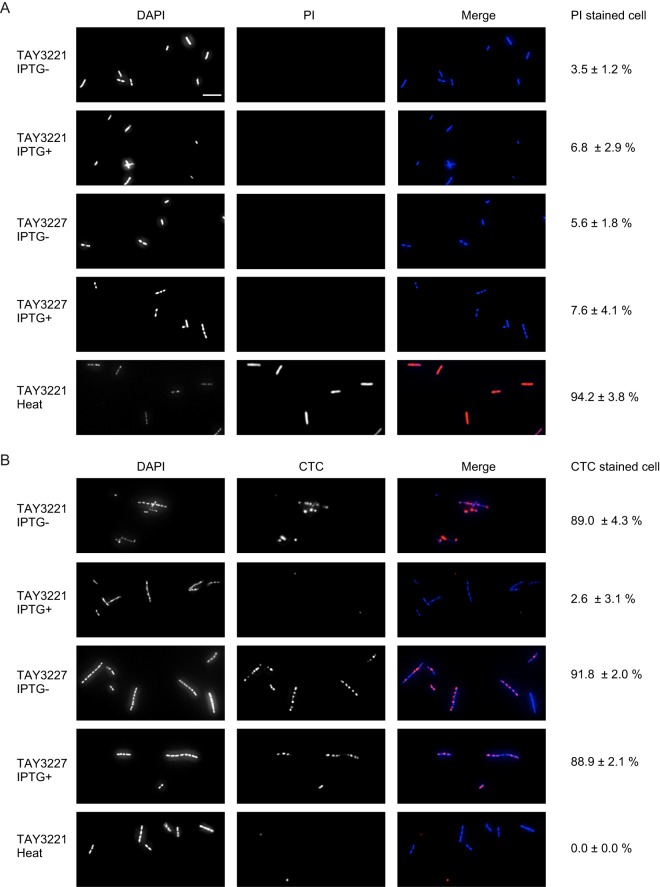
FIG 9.
Overexpression of NonA reduces respiration activity. Fluorescence microscopy images (magnification, ×640) of TAY3221 and TAY3227 with or without 1 mM IPTG for 1 h. The dead-cell control is TAY3221 incubated at 80°C for 30 min. Cells were stained with DAPI (blue) and PI (red) (A) or with DAPI (blue) and CTC (red) (B). Scale bar, 10 μm. Ratios (percent) of cells stained with PI or CTC were calculated from three independent experiments. Standard error values are included.

