FIG 5.
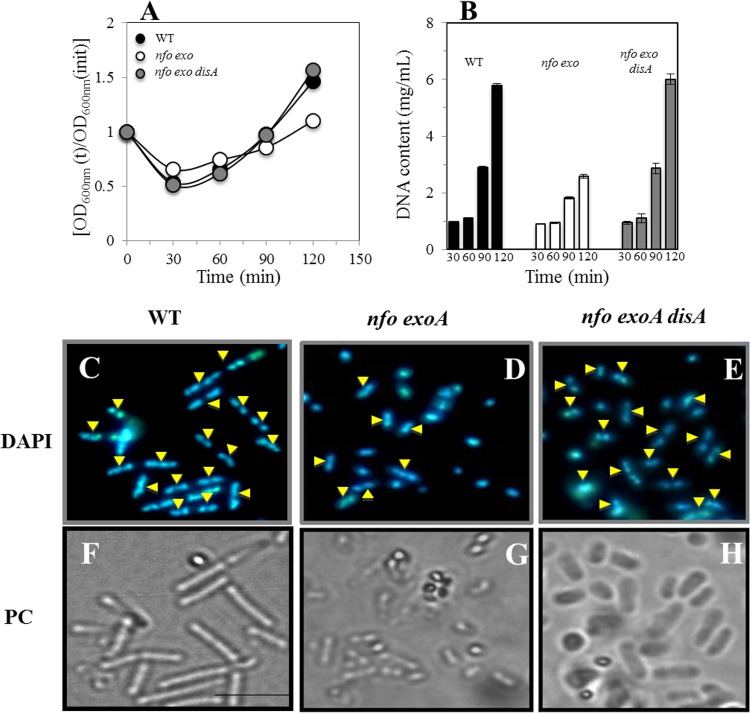
Outgrowth, DNA concentration, and microscopic analysis of chromosome segregation in outgrowing spores of different B. subtilis strains. (A) Heat-shocked spores of wild-type (WT), nfo exoA, and nfo exoA disA strains were germinated, and spore germination and outgrowth were measured by monitoring the OD600 of cultures, as described in Materials and Methods. (B) Levels of DNA in samples from the cultures described in panel A, collected at different times during germination and outgrowth, were measured as described in Materials and Methods. (C to E) Outgrown spores collected 90 min after initiation of germination were stained with DAPI, examined, and photographed, as described in Materials and Methods. (C and F) DAPI-stained (C) and phase-contrast (PC) (F) images of wild-type spores. (D and G) DAPI-stained (D) and phase-contrast (G) images of nfo exoA spores. (E and H) DAPI-stained (E) and phase-contrast (H) images of nfo exoA disA spores. Yellow arrowheads show cells that have replicated and segregated their chromosome. For each strain, >200 cells were analyzed in 6 different fields.

