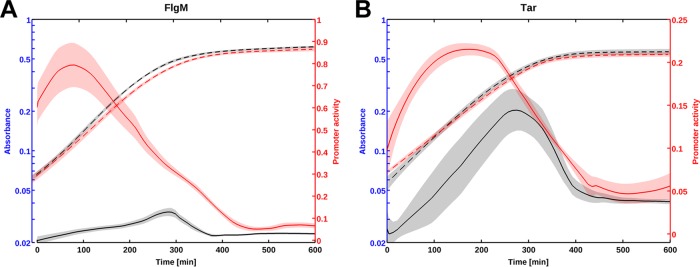
FIG 2.

The flagellar gene cascade is repressed by RpoS at several levels. (A and B) Typical gene expression profiles for flgM::gfp (A) and tar::gfp (B). The average promoter activity computed in the wild-type strain is represented in black, and the average activity in the rpoS mutant strain is shown in red. The bacteria were grown in M9 minimal medium at 37°C (see Materials and Methods). Promoter activity is expressed in RFU/min (relative fluorescence per time), derived from the kinetics of the absorbance and GFP reporter data.
