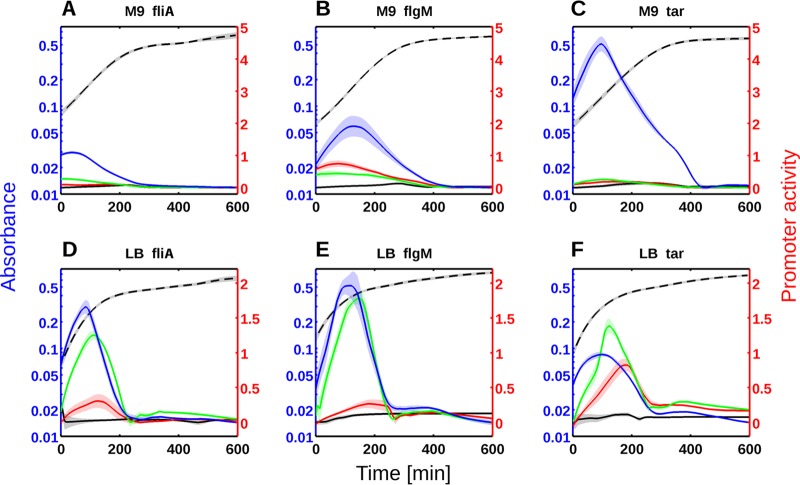
FIG 4.
Repression of flagellar class 2 and 3 genes by RpoS, CsgD, and CpxR in M9 minimal medium (A to C) or LB medium (D to F). Gene expression profiles were monitored for fliA::gfp (A and D), flgM::gfp (B and E), and tar::gfp (C and F) in the wild-type (black), rpoS (red), csgD (green), and cpxR (blue) mutant strains. Absorbance at 600 nm is shown on the blue axes, promoter activity (relative units) is shown on the red axes, and time of growth (in minutes) is shown on the black axes. The black broken-line curve represents a typical growth curve (absorbance at 600 nm) of the WT strain at 37°C. A minimum of five experimental data sets were used to generate each expression profile (average activities and standard errors of the means). The standard errors of the means are indicated by the shaded regions of the curves. Promoter activity is expressed in RFU/min (relative fluorescence per time), derived from the kinetics of the absorbance and GFP reporter data.

